Modeling
Event Modeling Risk Assessment using Linked Diagrams
For details on modeling using EMRALD see the documentation – https://emrald-docs.inl.gov/
Constructing an EMRALD model consists of building multiple state diagrams with pieces corresponding to aspects of traditional PRA modeling. This model is most effectively created through the web based GUI, although the GUI does export an XML file that could also be modified with an in-depth knowledge.
At any given moment when running an EMRALD model, it is in a set of states. These states determine what the model is to do; what events to monitor for; and where to transition.
Pieces
The Diagram consists of the following main items:
States – A logical representation for the condition of a component or system.
- Types
- Start – the beginning state when simulation begins (one or more)
- Standard – a normal state representing no special conditions
- Key State – marks a state of interest, to be tracked and reported if in this state at the end of a simulation. (All “End Sates” from traditional PRA should have a corresponding “Key State”)
- Terminal – user-defined simulation stopping point
- Immediate Actions Section – actions taken when a new state is entered
- Event/Action Section – events to look for when in this state and what action to take if the event is triggered
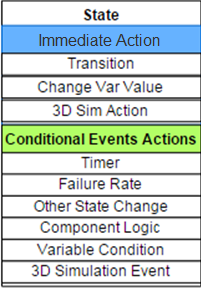

Actions – Actions are executed when entering a state or are performed when an event is triggered.
- Transition – Start, exit, or move to a new state or states. Indicated by arrows on the diagram. Can be probabilistic if moving to more than one state.
- Change Value – Adjusts the value of a variable.
- External Communication – Send a message to an external code such as a 3D simulation.
- Execute Application – Runs a user defined script. Starts up an executable with the results of that script. Runs a second user defined script to post process any results from the executable and adjusts current states according to results of the script.
Events – Monitor for specified criteria and have one or more actions that are executed when that criteria is met.
Time Based Event Types- Timer Event – monitors the current time against a time of interest.
- Fail Rate Event – uses the sampling of a given failure rate to determine the execution time
- State Change Event – monitors when entering or exiting a specified state to determine the execution point
- Component Logic Event – evaluates a logic model of component diagrams to determine execution point
- Variable Condition Event – monitors variable values with user-defined code to determine execution point
- External Sim Event – links to an external simulation flag to determine execution point
Diagrams
A model consists of multiple diagrams. Each diagram represents a particular piece of the model and the various conditions or states that this piece of the model can be in. These pieces correlate to aspects of traditional PRA modeling and range from small-scale components to a large scope, overall plant response and design. A diagram contains multiple states with the events that can occur, actions that can be executed and variables used. These all define how the simulation may sift through the diagram over time.
Additionally, some diagrams (Component and State) can also be evaluated to a Boolean depending on which stat they are currently in. This is a key feature that when combined with a Component Logic Event, can greatly simplify a model. Unlike the more general diagrams like plant response, these diagrams are restricted to only be in one state at a time, in order to execute the evaluation process.
Types of diagrams include Component, System, Plant Response, and External Simulation Integration.
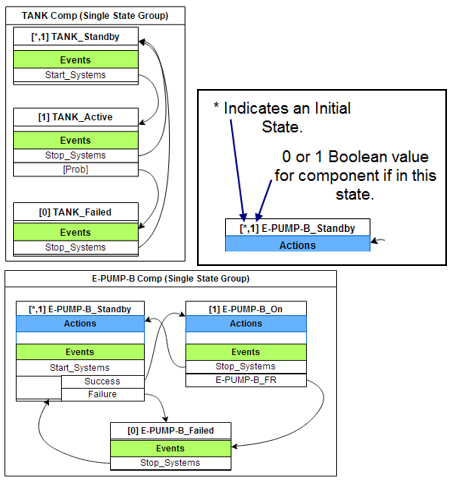
Component Diagrams (encompass PRA Basic Events)
- All aspects of a component can be captured in a simple Component Diagram.
- PRA Basic Events are captured by events in one of the component states.
- Events can be shared between different components (common cause).
- Component state diagrams are required to be “Single State Diagrams” meaning the simulation can only be in one of those states at any given time.
- Each State has a Boolean evaluation value, which can represent things like OK or Failed.
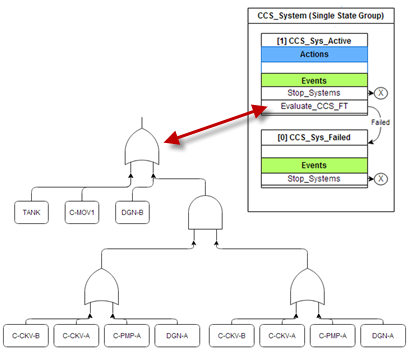
System Diagrams (Fault Trees)
Once components are modeled, a Fault Tree from traditional modeling can be directly converted into System diagram with two states and a special event used to evaluate Boolean logic. The two states are “Active” and “Failed”, with a “Component Logic” event in the active state evaluating the assigned logic whenever a component diagram state changes. If the logic ever evaluates to false, then the current state shifts from “Active” to “Failed”. (See Figure 10) This is similar to a typical PRA model except the logic does not contain any probabilities, just references to the Component diagrams.
- Adding a Component Logic Event can evaluate a logic diagram. This is similar to traditional PRA Fault Trees evaluation.
- The Boolean Value of each component’s current state value is used in the evaluation of the tree.
Plant Response Diagram (Event Tree Sequences)
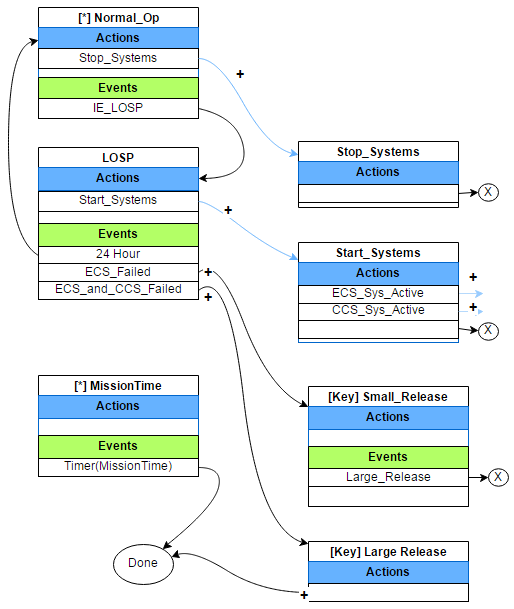
Finally, we have Plant Response diagrams. These diagrams are the main scenarios to be evaluated, similar to Event Trees. This diagram has a starting state such as Normal Operation and a Mission Time state. Other states can do general evaluation and movement or be a key end state. Here the user defines the various states and events that drive the simulation from an initiating event to a desired end state.
For example, if an evaluation is needed for “loss of offsite power” (LOSP) that failure rate is added to the normal running start state for the Plant Response diagram. If that event occurs, the state shifts to the LOSP state. The LOSP state immediately starts new states to evaluate the related systems and waits for any events that trigger new key state. When the evaluation ends, all key end states that are in the current state list are logged with the timing and paths of all the states and events that lead to this state.

External Simulation Integration
EMRALD can be loosely coupled with external solvers through a network messaging protocol. Currently, EMRALD can provide direction to the Neutrino 3D fluid solver analysis module. A planned enhancement is to make this functionality available to other applications through an open-standard built upon the XMPP messaging protocol.
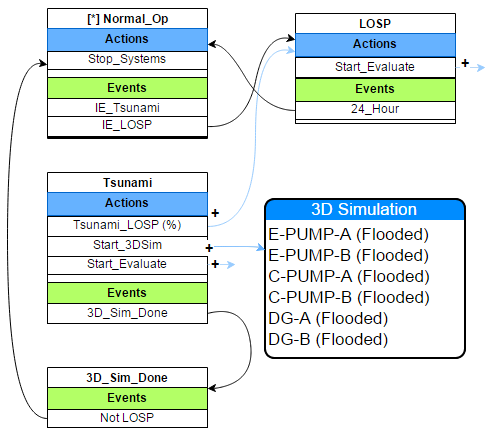
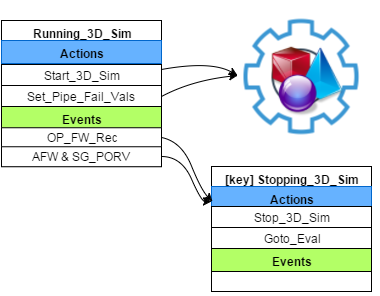
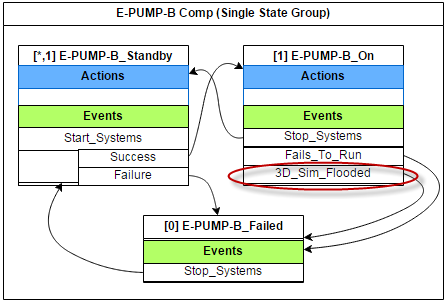
Integrating 3D simulation into the state diagram model is just a matter of starting the user specified 3D simulation when needed and receiving events that can trigger a state change. For each component that can have a failure from the 3D simulation, we must add a 3D simulation failure event in the component state diagram.
EMRALD can be loosely coupled with external solvers through a network messaging protocol. Currently, EMRALD can provide direction to the Neutrino 3D fluid solver analysis module. A planned enhancement is to make this functionality available to other applications through an open-standard built upon the XMPP messaging protocol.
Then, in the Plant Response diagram we need a “3D Sim Action” to start the simulation. As an example, we will add a Tsunami initiating event probability to the diagram show in Figure 11. This event triggers a move to the Tsunami state, which possibly triggers LOSP, starts the 3D simulation, and starts evaluation of the systems. Evaluating the state diagrams now consists of evaluating the next state diagram event or waiting for the next 3D simulation event.