This summer, the U.S., Canada and Mexico will jointly host the largest FIFA World Cup ever. An estimated 6 million soccer fans will fill stadiums in 11 American cities, including Seattle, Los Angeles and Kansas City. The Idaho National Laboratory’s critical infrastructure analysts are working behind the scenes to help keep these urban centers safe.
Their mission: account for every substation, water treatment facility, pipeline and hospital near an event during a time of heightened vulnerability.
The team’s work goes far beyond mapping data points — it’s about uncovering the complex web of interdependencies that keep our cities functioning.
“We find and catalog physical assets like water treatment plants, emergency communications, commuter and freight rail lines, and convention centers, and then determine the various connections and dependencies among them,” said Rob Edsall, a geospatial scientist and project lead within INL’s Critical Infrastructure Security and Resilience division.
For instance, what happens if a cyberattack shuts down a potable water master pump station supporting a hospital’s water supply? An accident or attack that disrupts that pipeline might affect all downstream infrastructure and services. These connections exist but are rarely mapped. That’s where the INL team steps in.

Event-based buildouts
Edsall’s team collaborates with the Department of Homeland Security’s Cybersecurity and Infrastructure Security Agency (CISA) to reduce risks at major events, focusing on threats like cyberattacks, natural disasters and terrorism. INL gathers and analyzes infrastructure information, focused on one metropolitan region around the event, to help CISA advise local and state officials, protect the public, and ensure the smooth functioning of these events.
These high-intensity “sprints” typically last six to eight weeks and involve mapping critical infrastructure facilities and their dependencies across 16 sectors, including energy, water, health care and transportation. Stakeholders in individual sectors understand their systems, but they often overlook cross-sector interdependencies and geographic consequences.
INL’s analysts have supported events like the Boston Marathon and the Republican National Convention, and have conducted post-event analyses, such as on Baltimore’s infrastructure after the Key Bridge collapse, but are now focused on America 250 and the FIFA World Cup.
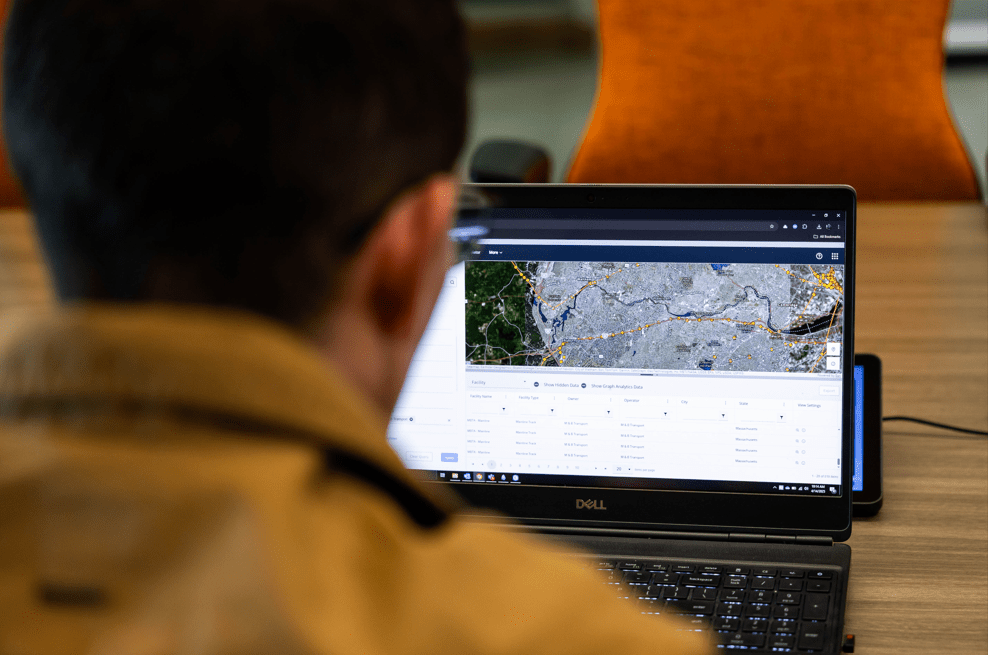
All-Hazards Analysis tool
The team’s geospatial mapping tool, All-Hazards Analysis (AHA), emerged from the Laboratory Directed Research and Development program, which funds high-impact research that aligns with INL’s core capabilities. AHA has flourished since 2014. The tool is now funded by multiple federal agencies and licensed to several state governments and organizations to manage infrastructure risk through dependencies analysis.
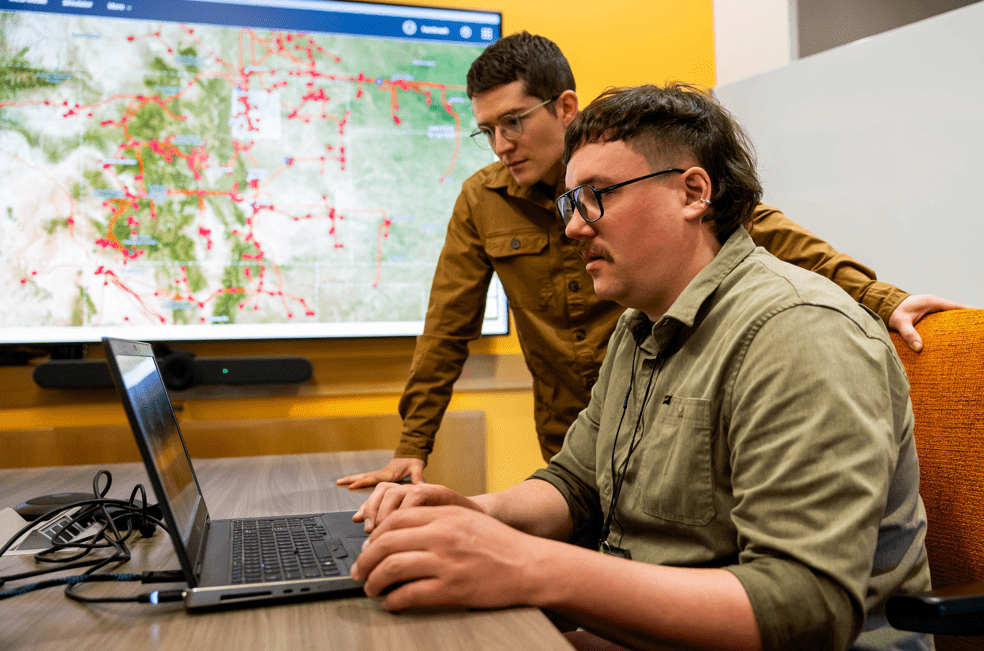
Colter Green, an INL critical infrastructure security analyst, began working with AHA as an intern in 2019, mapping water system assets in northwest Washington. The project focused on assessing the water system’s resilience in case of an earthquake or tsunami from the Cascadia Subduction Zone, a geologic feature off the Pacific Northwest coast. Green’s data helped answer a critical question: How will an earthquake or tsunami impact the clean water supply for the 6 million people living in western Washington?
Using open-source data, Green mapped assets and connections. AHA captured and visualized his data, which helped local and state planners prepare mitigation strategies. These early projects set the stage for his continued work in infrastructure modeling and national preparedness.
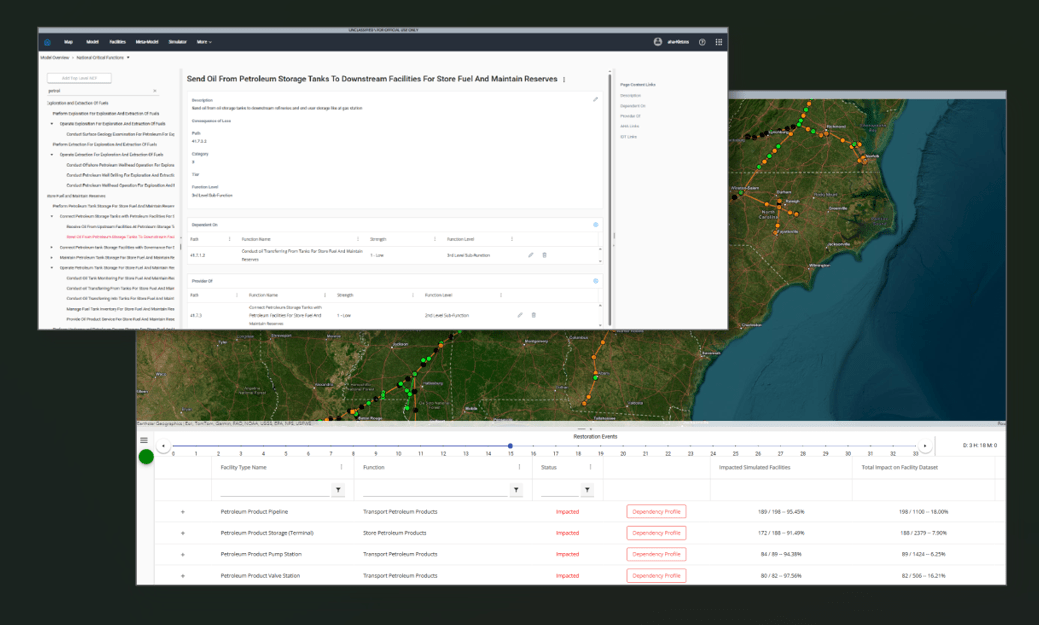
Reading between the pipelines
The INL team has already used AHA to prepare data sets and maps for several World Cup host cities including Seattle, Kansas City, Los Angeles, New York/New Jersey, Philadelphia and the San Francisco Bay Area.
The Seattle buildout recreated a dependency model of the downtown steam generation system. In Los Angeles, the focus was on road transportation. This analysis encompassed traffic counters and connecting regional petroleum production to local fuel terminals.
One of Green’s biggest challenges is finding data. While some cities publish detailed plans, access to infrastructure data is rare.
Critical infrastructure in the U.S. is often privately owned, with owners wary of sharing information despite its importance to emergency planners and public safety officials.
Harvey Hembree, another INL critical infrastructure security analyst, has developed creative ways to work around these data gaps. “When we can’t gather data from the top down, we use tools like Google Maps street view and satellite imagery,” said Hembree. “Sometimes we end up reading public records like city council meeting minutes that give us information about replacing a sewage pump on Smith Street.”
When data isn’t available, Hembree turns to spatial heuristics — inferences based on patterns and proximity. For example, knowing a water treatment plant’s location and its service area’s elevation profile allows for educated guesses about locations and dependencies of related infrastructure, like pump stations or water towers.
State and local decision making
Once INL completes an infrastructure buildout, the data is handed to CISA partners. From there, regional analysts serve as liaisons between federal agencies and local planners, offering services of broader context and guidance to state officials.
The AHA-generated data is used to run scenarios that improve risk management and emergency response. These insights help identify vulnerabilities, inform decisions and support national security.
“This capability hasn’t really existed before now,” said Edsall. “The societal relevance of our work is clear. No private company is going to do this — there’s no profit in it. We do it in support of state preparedness and national security. If we don’t understand these systems, it puts our country at risk.”
Future events
As the countdown to the World Cup continues, INL’s geospatial analysts are already looking at other future high-profile events. With data buildouts completed for the 2026 Super Bowl in Santa Clara and more planned for the 2028 Olympics in Los Angeles, the team is expanding the reach and refinement of the AHA tool.
By mapping the unseen, overlooked connections that underpin modern life, INL is helping build a safer nation — one city, one system, one scenario at a time.